

From insight to action: The rise of Data Product Engineering in scaleups
How operational analytics evolved into internal products at Gozem, and how AI-assisted engineering changed the economics of building them.

The data team I founded at Gozem still does the job. It also does much more.
When I joined Gozem1 in 2019, there was no data team to inherit. Building one meant doing the usual founding work: picking the stack, defining the warehouse, designing the metric layer, setting the contract with the rest of the company, building the first pipelines and models, and so on.

The mandate was simple: data in -» insight out -» human decides. Batch most of the time, realtime occasionally, but always the same flow.
That mandate held for a while. Then it stopped holding.
The shift: when analytics becomes product
The timing was not unique to us. It breaks fastest at small or mid-size companies transitioning from startup to scaleup. The product team is fully booked on revenue surfaces. Meanwhile, operations, finance, growth… teams start asking for things that look nothing like dashboards:
“We already have the metric. Can the system act when it crosses a threshold?”
“We need a portal where hundreds of field agents track their performance and revenue.”
“Finance is processing thousands of bills manually. Can we automate invoice extraction?”
“Can we get a no‑code interface to query our data faster?”
These are not only analytics requests anymore. They are product requests. They need UI, authentication, database, workflows, ownership, and a lifecycle. They are also too internal, too vertical-specific, and too time-sensitive to wait for the main product roadmap. The data team already owns the upstream (the pipelines, models, metrics…). The gravitational pull is obvious.
The data team becomes a product team for internal operational analytics. Not by ambition. By gravity.
Why it happens, and what it is not.
This is NOT “the data team is taking over from product.” NO. Scaleups face a recurring constraint: Product teams stay focused on customer revenue surfaces while operational teams accumulate unmet internal tooling needs. These tools matter deeply as they boost operational efficiency and turn metrics into actions, but barely make it onto the main roadmap. They used to live as Streamlit apps, one-off scripts, or spreadsheets. Now they need to be real applications: versioned, authenticated, role-scoped, observable, logged.
Some years ago, building a platform required a full product squad. In 2026, one experienced data guy with working with a coding agent can scaffold a secure analytics microservices platform in days, not weeks, especially when it does not demand deep architectural or business reasoning. LLMs have collapsed the cost curve enough that capacity is no longer the bottleneck. JWT plumbing, migrations, conventions, CI templates... Consistency at scale is one of the hardest problems in small teams. Coding agents close that gap by effectively doing the boring work the same way every time. Senior oversight is still important on security-critical surfaces such as auth scoping, secret handling, and tenant isolation, but the floor of what one operator can deliver has moved up sharply.
The Gozem Data Hub bet
When operational analytics outgrew spreadsheets and one-off scripts, we made a bet in three parts.
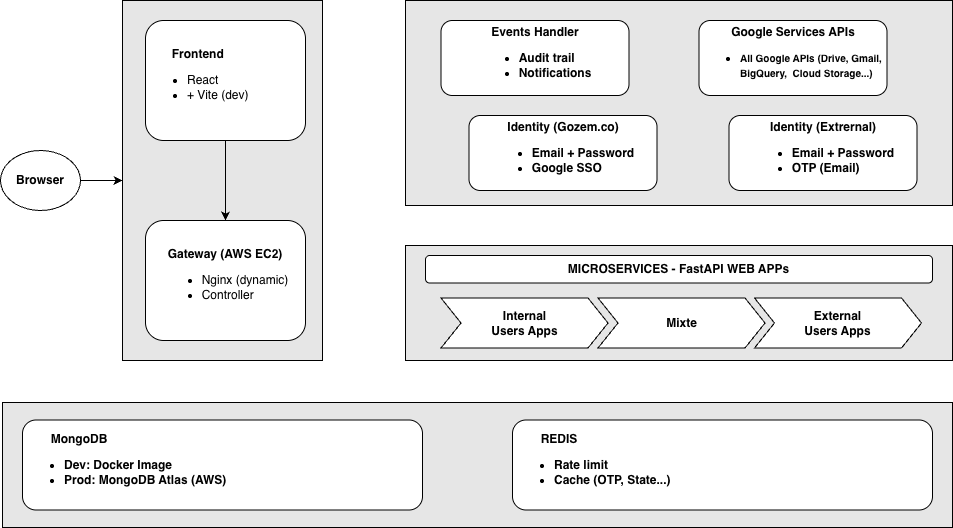
One platform. One auth. One gateway. One frontend shell. One set of patterns. The stack intentionally prioritizes simplicity over novelty: FastAPI, MongoDB, React, Redis. Expensive dependencies centralized.
The data team owns it end to end. Because we already owned the upstream. The services mix data-powered work (eg. KPIs explorer, Agents performance tracker…) with AI-powered work (eg. invoice extractor built on Gemini…). AI is a capability, not a separate platform.
Two populations use it directly. Internal users via Google SSO. External partners via OTP. Both interact with accurate, scoped data without bottlenecking on a data professional.
The data team builds the surface. The operation runs on it.
How it ships.
The overall project is modular, with each backend in its own GitLab repo. A central frontend mounts every service through one shell. Shared CI templates standardize build, testing, security scanning, and deployment across services, reducing the marginal cost of new tooling. Images land in Google Artifact Registry. Production runs on a single host with Docker Compose. No Kubernetes yet. The platform is too small for it to be worth any complexity. The day the one host is no longer enough, DevOps scales up. Until then, nightly volume snapshots and a tested rebuild-from-image runbook keep recovery time inside an hour, which is below the cost of running redundant infrastructure at this size.
We also ship some supporting services beyond analytics. Some examples are the driver vehicle inspection lifecycle, and User Stories, a tool to publish versioned, mostly AI-generated HTML reports built on our data warehouse MCP connection with Claude. But below the focus will be on two purely analytics use cases. One full product: the external field agent (G-Force) performance tracker. One lighter pattern: location-based market monitoring for public events with automated triggers.
While some previous on-offs systems encoded workflows directly into orchestration logic, the Data Hub turns the same operational pattern into reusable infrastructure: standardized orchestration, shared compute primitives, scoped authorization, and configuration-driven deployments.
Beyond dashboards: two patterns of analytics that act
Case 1. Event live monitoring: when dashboards learned to talk
Between mid December and mid January 2026, Benin saw one of West Africa’s highest concentrations of end-year events. WeLovEya in Cotonou. Vodun Days in Ouidah. To respond to transportation needs for thousands of attendees in a small town like Ouidah, dashboards alone were not enough. Automated actions, triggered by metrics live, were essential.

The data inventory
We already had driver positions, activity states, user sessions, and ride requests. But Ouidah was not modeled. The operations team collected new event-specific data like major venue locations and parking lot locations, drawn as polygons, exported as KML, loaded into our lakehouse.
We needed to cross these new datapoints with existing product data to track supply, demand, conversion, no-activity-out-of-parking time, a composite driver score, and event-linked activity rate especially for some dedicated drivers.
What we built
Python and Airflow micro-batches every few minutes. BigQuery models feeding Data Studio dashboards. Google Chat alerts triggered by thresholds, ratios, and windowed aggregations. No ML. Thresholds were enough.
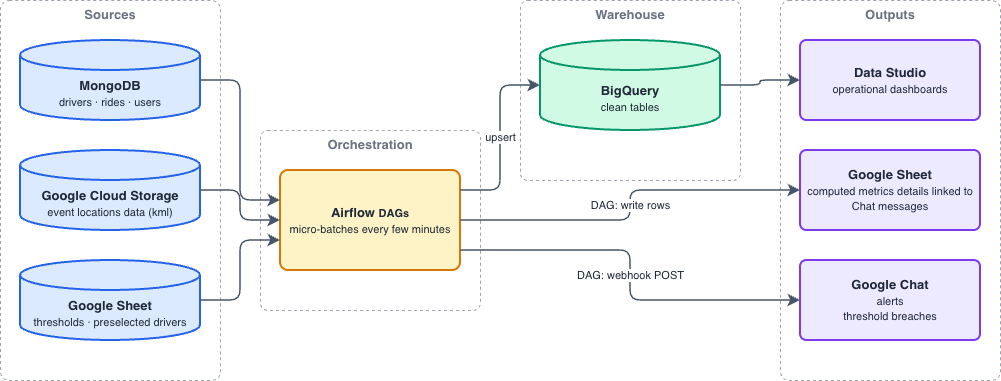
Each alert was actionable: call the driver lead, reassign someone to Lot B, check if a driver was off roster, push a notification to roster drivers. The cycle compressed from next morning’s debrief to next ten minutes.
The architectural lesson
The dashboard stopped being the terminal node.
That is the architectural shift. One metric stream. Many consumers. Each triggering a different downstream behavior.
But a collaboration with Product Team would amplify this. A driver-app endpoint like below would let the pipeline push a recommendation directly to the right driver.
POST /drivers/{id}/operational-nudgeBut that “small task” has a precondition: the notification service has to already be modular and exposed as an authenticated API. If notifications are coupled to the trip lifecycle, “one endpoint” turns into 2 to 4 weeks of mobile and backend rework. Two weeks does not survive a fixed festival date.
Precondition met: in-app nudge plus Chat plus human-dispatcher for enforcement.
Precondition not met: the data team owns the whole loop, and human-dispatchers reach drivers by phone or WhatsApp.
Hundreds of drivers in one small town with ten coaching dispatchers? Google Chat (or Slack, or MS Teams) is fine. Thousands across multiple cities? In-app stops being optional. Confusing the two is the failure mode.
What it produced
Peak event day pushed ride requests up 48% and request-level supply rate dropped 14% below normal baseline. At the user layer, 88% of requesting users still got matched, with median wait up only 9%.
The gap between supply layers is what acting analytics bought: drivers were moved fast enough that almost 9 users over 10 who missed on first request matched on retry. The system measured, alerted, routed, repositioned, and retried. Without that chain, the gap would have surfaced at the next morning’s debrief. By then the riders are gone.
Supply scaled on purpose. A pre-mobilized driver pool came online for the event, moved into position by live alerts. The 12% missed fed the prep list for next year. Thresholds were enough at this fleet size. At ten times the scale, the natural next step is dispatch policies tuned on prior events.
Case 2. G-Force: the field agents performance tracker
Sometimes the request is bigger. “We need a full app for our external acquisition partners.”
G-Force is a program where individuals earn money by bringing customers, drivers, or merchants to Gozem. To strengthen trust, agents need visibility into their activities processing, their payments, and their objectives.
An early version of such an app, limited to analytics, can be fully owned by the data team.
The security we built
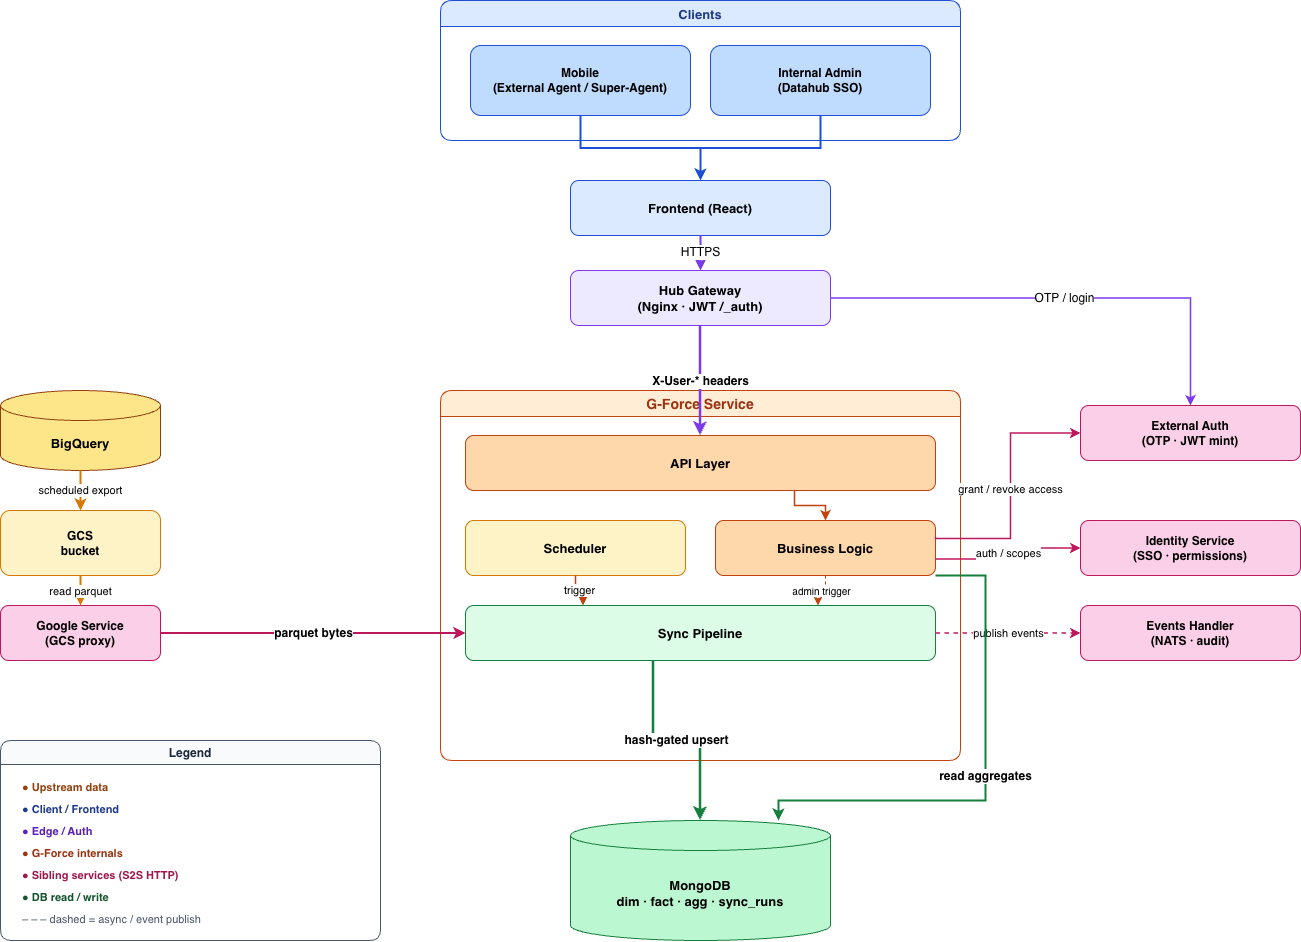
G-Force agents are not employees with Gozem work emails, so we built External Auth. It verifies an agent’s email against a MongoDB agents collection, sends an OTP by email through the Data Hub’s Google client, and mints a dedicated external JWT.
Every Mongo query is scoped at the FastAPI dependency layer, not individually at the route or service layer. The reason is structural: route-level scoping is easy to forget, and service-level scoping can be bypassed or inconsistently applied. Dependency-level scoping centralizes tenant/agent isolation before business logic runs, making IDOR bugs much harder to introduce and reducing reliance on human review.
The data stack
We split storage by purpose: BigQuery for history and analysis, Mongo for low-latency reads in the app.
BigQuery is the source of truth for all activity data, but querying it on every agent login is not cost-effective. Instead, data is exported through GCS and synchronized into a dedicated MongoDB operational store that powers the web application.
The pipeline is orchestrated through Airflow for ingestion, fraud filtering, payment submission, and operational sync. Reliability is enforced through idempotent, restart-safe synchronization, deduplicated upserts, execution tracking, and distributed locks.
The business impact
What the G-Force Performance app brought is straightforward. Agents stopped calling super agents (captains). Super agents stopped calling ops. Ops stopped exporting spreadsheets. Every commission and every sync run is auditable. The data team stopped being a support function for this question entirely, and the hours that used to disappear into spreadsheet exports and explanation calls now compound into new services on the same platform.
The cost of building internal operational tooling properly has fallen enough that many historical shortcuts are no longer economically justified.
Data Product Engineering: The emerging discipline
Not every data person will make this transition. But the role exists. Data product engineering emerges when the deliverable is no longer a metric or a model, but a running system that uses them operationally. Organizations that structure for this capability early gain significant operational leverage.
This pattern tends to emerge fastest in small and mid-sized companies where platform teams are thin and operational pressure is high. In more regulated or infrastructure-heavy organizations, the same function is usually distributed across platform engineering and internal tooling teams. As platform engineering matures, the services that prove themselves could migrate to where they belong long-term. But before that, three things worth taking from this:
Build one platform, not ten disconnected apps. The first three services cost 3× the effort; the tenth costs 0.3×.
Make scoping structural, not procedural. Never rely on “remember to filter by user_id.”
Centralize expensive dependencies and operational surfaces. One credential boundary. Shared agents.
Traditional analytics engineering doesn’t capture the full operational ownership involved. This is data product engineering: product engineering for data-powered operational systems.
If you have built or are building this capability inside a scaleup, or wrestling with the same shift from dashboards to systems-that-act, I’d like to compare notes. Reach out !!!